This analysis is intended to describe the existing demographics of the Town of Westboro and identify the major demographic trends impacting Westboro over a 20-year planning period.
Historical Population
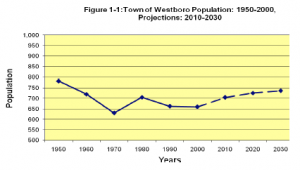
In the last half century, the Town of Westboro’s population has been fairly erratic. Overall it has dropped by 123 people. From 1970 to 1980 the town gained 75 people, but then declined by 46 people from 1980 to 2000. Table 1-1 details the population changes from 1950 to 2000 in the Town of Westboro.
Population Forecasts
The Wisconsin Department of Administration Demographic Services Center determined the following population projections in 2008. The projections were based upon past and current population trends. Table 1-2 illustrates population projections for the Town of Westboro.
Age Characteristics
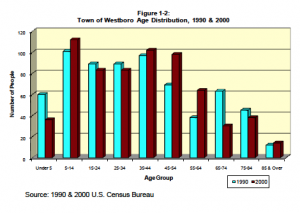
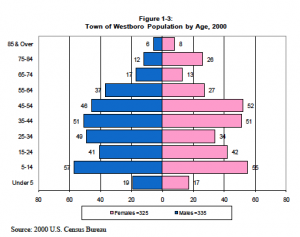
The following two figures show age distribution and population by age for the Town of Westboro. Figure 1-2 shows the Town of Westboro age distribution for 1990 and 2000. Since 1990, persons between the age of 65 and 74 decreased the most, losing 33. Persons aged 45 to 54 increased by 29, and persons aged 55 to 64 increased by 26. In the tenyear period the town lost a total of 3 people. The population pyramid in Figure 1-3 represents a visual depiction of the age categories for 2000 in the Town of Westboro.
Households
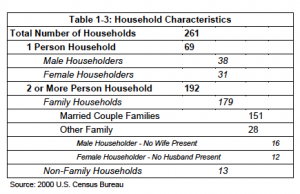
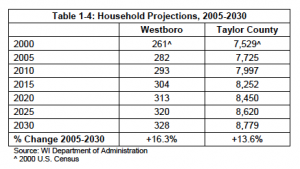
Households are defined as a person or group of persons who live in a housing unit. In a regular census count, these equal the count of occupied housing units. The 2000 U.S. Census identified 261 households in the Town of Westboro. Of those, 179 are family households and 82 are non-family households. The average size of Westboro households is 2.53 persons per household, which is similar to Taylor County (2.58).
Household Forecasts
Like population, household projections were completed in five year increments between 2000 and 2030. Household projections were derived by the Wisconsin Department of Administration. Assuming a moderate rate of growth, the number of households in Westboro is estimated to increase by 46, or 16.3 percent between 2005 and 2030, approximately two per year. This is approximately three percent higher than Taylor County’s increase of 13.6 percent. Household projections for the Town of Westboro and Taylor County are displayed in Table 1-4.
Education and Income Levels
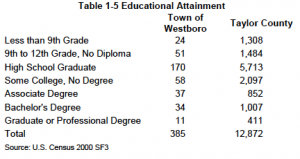
According to the 2000 Census, 80.5 percent of town residents in the Town of Westboro have a high school education or higher, which is higher than that of Taylor County at 78.3 percent.
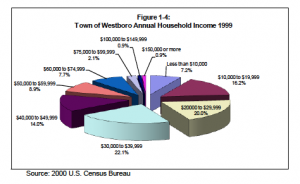
Median household income for the Town of Westboro was $33,021 according to the 2000 U.S. Census. This is considerably lower than Taylor County’s median household income of $38,502. Figure 1-4 breaks down household income in the Town of Westboro.
Employment Characteristics
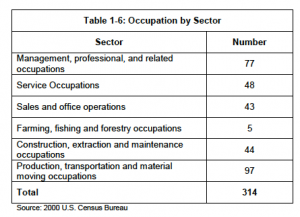
Table 1-6 illustrates the breakdown of the employed population of the Town of Westboro in 2000. The ‘employed population’ is defined as people living in the town who are 16 years and older and had a job at the time of the Census. In 2000, the town had an employed population of 314.
Employment Projections
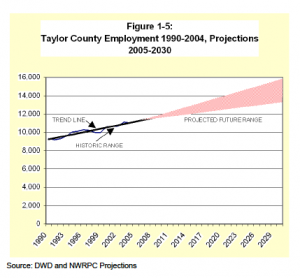
By analyzing Wisconsin Department of Workforce Development (DWD) employment data for Taylor County from 1975-2003, NWRPC derived employment projections for Taylor County. Figure 1-5 reveals employment projections for Taylor County to 2030.
Overall Goals, Objectives and Actions
The overall goal is to maintain the quality of life in the Town of Westboro. To do this, the overall objective is to guide future development and redevelopment of the community in a manner consistent with the element goals, objectives, actions, and identified programs contained in this document. The overall result is to adopt and implement the comprehensive plan and continue to work in partnership with others.
If you can't find what you are looking for on this website, please provide feedback.


